The Frost Laboratory: Integrative and Applied Chemical Ecology
Service and Outreach
We depend largely on public financial support for doing the work that we do, and it is our obligation (and joy!) to share what we learn beyond our scientific community. My background and interest in experiential environmental education had prepared me well to address the broader impacts of our research.
One specific long-term, ongoing initiative is a workshop I first developed in 2007 and that I subsequently entitled the "Million Leaf Project". The idea was to formulate a hands-on field experiment module, based on a simple method I use in my published field research, that allowed students of all ages to understand and participate in the scientific method applied to field ecology. The module was originally designed as part of my volunteer work with non-profit educational organizations in the Peruvian Amazon.
One specific long-term, ongoing initiative is a workshop I first developed in 2007 and that I subsequently entitled the "Million Leaf Project". The idea was to formulate a hands-on field experiment module, based on a simple method I use in my published field research, that allowed students of all ages to understand and participate in the scientific method applied to field ecology. The module was originally designed as part of my volunteer work with non-profit educational organizations in the Peruvian Amazon.
The Million Leaf Project
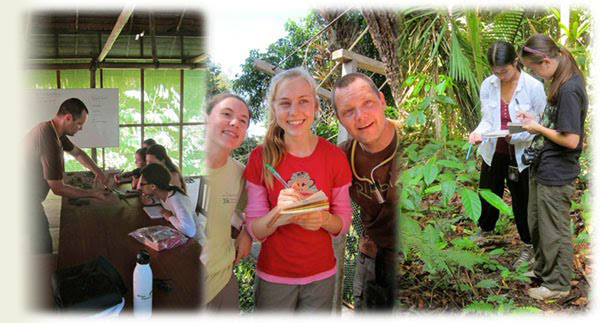
Observation of natural processes is a cornerstone of hypothesis-driven science. I developed a workshop to teach participants how to visually estimate herbivore damage on plant leaves, based on a method that I learned in graduate school and that has been a methods component of my published literature. Participants experience a hand-on introduction to how much damage plants face in their lives, including collecting their own data. We then analyze the data as a group, where we use their own data to reveal trends, discuss statistical inference and biological significance, and plan future research. This is an ongoing, long-term project that has been running for eight years. This is a key activity for the "Million Leaf Project." The workshop is designed to be portable and scalable. That is, it can be done in any habitat and with any level of participant from middle school to graduate participants and "citizen-scientists".
Primary producers such as plants are the main route through which energy enters ecosystems. One fundamental process in any ecosystem the consumption of primary producers by herbivores (primary consumers). Since most plants escape herbivory most of the time, the importance of herbivory and plant resilience can be overlooked. One objective of the workshop is to explore leaves in depth and, in so doing, learn to examine explicitly the natural world.
Ultimately, the workshop addresses a fundamental question in plant-herbivore ecology:
HOW MUCH HERBIVORY DO FOREST TREES AND PLANTS EXPERIENCE?
Telling participants that herbivore pressure is "high" or "low" is fundamentally different from (and inferior to) allowing participants the opportunity to measure it themselves. Plants invest a large pool of resources in 'secondary metabolites', which often are not involved directly in growth or primary aspects of survival. Many of these secondary metabolites are implicated in defense against herbivores or disease. While this implies that these effects may be strong, it's always preferable (as a scientist) to have data to support the point!
The workshop is based on training participants to estimate insect herbivore damage suffered by forest trees in the Peruvian Amazon. They generate their own data, and we analyze and interpret the results on-site. Then, because I have generated a long-term dataset, participants are then able to compare their results to those collected by participants in years past. Students gain experience in field ecology, hypothesis generation, data collection, basic statistical analysis, data interpretation, and planning future directions.
I have done identical workshops in temperate forests and am excited to use it as part of an integrated strategy to promote forest health in which citizens are active participants monitoring damage levels of their forests and facilitate detection of pest outbreaks.
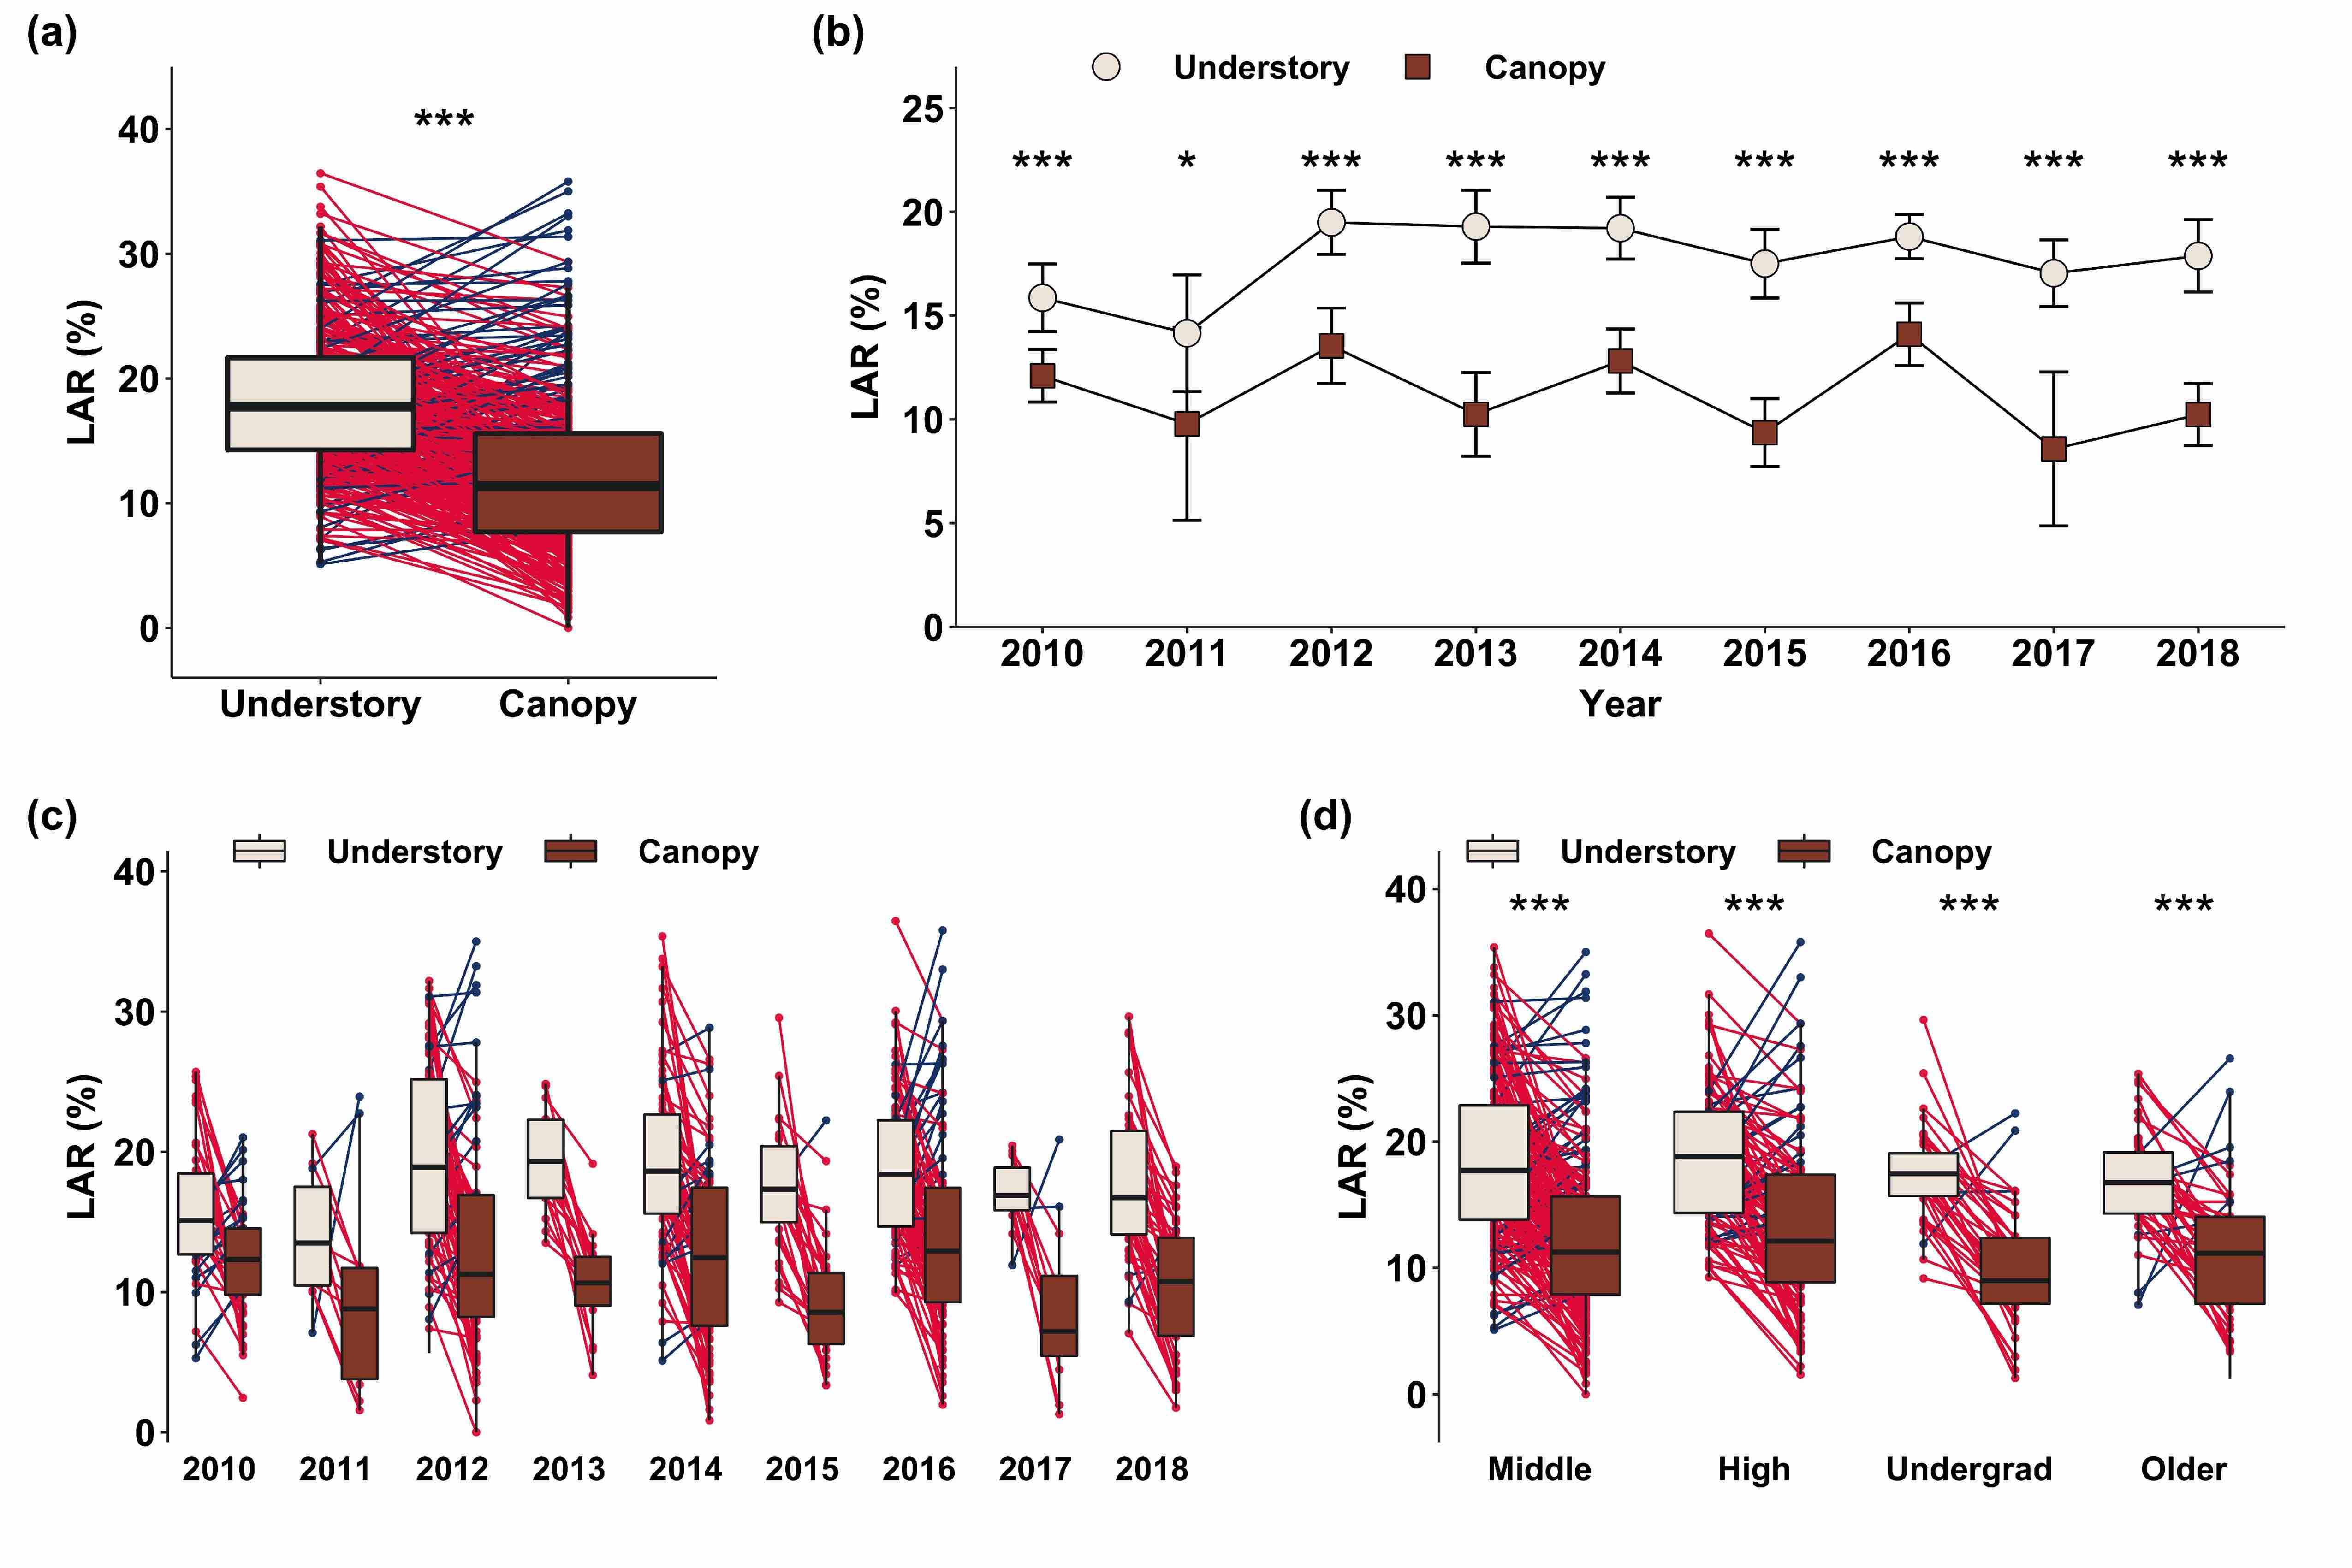
Nine years of damage estimates of leaves in the understory and canopy of the neo-tropical forest at the ACTS Walkway in Loreto, Peru. This dataset represents 175,421 leaf observations. Herbivory estimates (LAR) are arithmetic averages (a-d). (a) Box plot of LAR by location, (b,c) line and box plots of LAR by year, (d) box plot of LAR by participant age category. Points in (b) represent means +/- 95% CI. For box plots, dots and lines represent individual participants; red lines and dots represent the participants (83%) who recorded higher herbivory in the understory, blue lines and dots represent participants who recorded higher damage in canopy leaves. * p<0.05, ** p<0.01, *** p<0.001.
Frost CJ . A Visual Technique Used by Citizen Scientists Shows Higher Herbivory in Understory vs Canopy Leaves of a Tropical Forest. Ecology . [PDF] [Online]
Primary producers such as plants are the main route through which energy enters ecosystems. One fundamental process in any ecosystem the consumption of primary producers by herbivores (primary consumers). Since most plants escape herbivory most of the time, the importance of herbivory and plant resilience can be overlooked. One objective of the workshop is to explore leaves in depth and, in so doing, learn to examine explicitly the natural world.
Ultimately, the workshop addresses a fundamental question in plant-herbivore ecology:
Telling participants that herbivore pressure is "high" or "low" is fundamentally different from (and inferior to) allowing participants the opportunity to measure it themselves. Plants invest a large pool of resources in 'secondary metabolites', which often are not involved directly in growth or primary aspects of survival. Many of these secondary metabolites are implicated in defense against herbivores or disease. While this implies that these effects may be strong, it's always preferable (as a scientist) to have data to support the point!
The workshop is based on training participants to estimate insect herbivore damage suffered by forest trees in the Peruvian Amazon. They generate their own data, and we analyze and interpret the results on-site. Then, because I have generated a long-term dataset, participants are then able to compare their results to those collected by participants in years past. Students gain experience in field ecology, hypothesis generation, data collection, basic statistical analysis, data interpretation, and planning future directions.
I have done identical workshops in temperate forests and am excited to use it as part of an integrated strategy to promote forest health in which citizens are active participants monitoring damage levels of their forests and facilitate detection of pest outbreaks.
Link To Ecology Publication